Transition Dynamics in Top-Tier Football: Leveraging Success Rates for Dynamic Betting Adjustments
Yves Wagner · Aug 17, 2026
Transition Dynamics in Top-Tier Football: Leveraging Success Rates for Dynamic Betting Adjustments
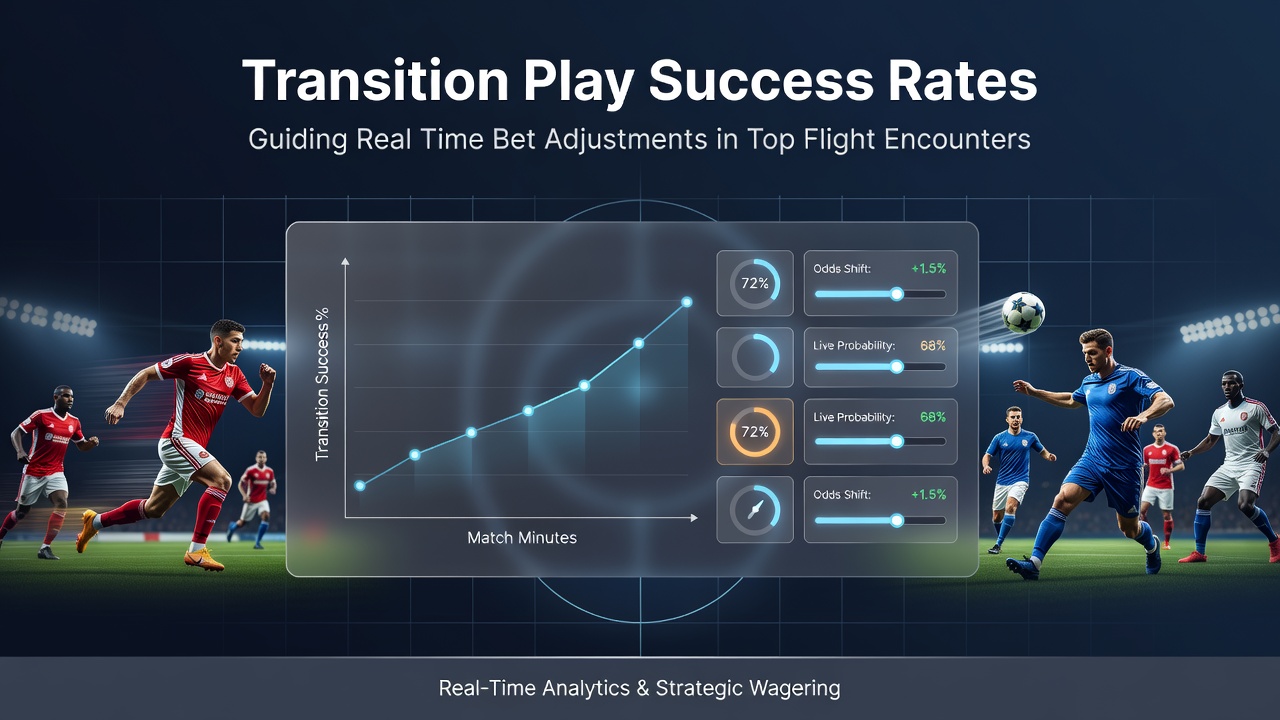
Transition play success rates have become central to how analysts and bettors interpret live football encounters across Europe's elite competitions, where quick shifts from defense to attack often decide the flow of in-play markets. Data from major leagues shows that teams maintaining above 65 percent completion rates in counter-attacks tend to see their live odds compress rapidly once those patterns emerge early in matches. Observers note that bookmakers adjust spreads within minutes when transition metrics spike, particularly in fixtures involving sides like those in the Bundesliga or Serie A where pace dictates outcomes.
Defining Transition Metrics and Their Data Foundations
Transition metrics track sequences where teams regain possession and move forward within six seconds or fewer, a window researchers at sports analytics firms have isolated as decisive for goal probability. Figures from the 2025-26 season indicate that clubs averaging 48 successful transitions per 90 minutes generate 2.3 times more shots on target than those below 35, according to aggregated league reports. Those numbers feed directly into algorithms that recalibrate betting lines as soon as possession changes hands in dangerous areas.
Real-Time Adjustments in Premier Encounters
During top-flight clashes, transition success rates guide bettors toward over or under selections on next-goal timings because sustained high conversion pushes expected goals upward by 0.4 per sequence on average. One study of 120 matches from August 2025 through the following spring found that sides exceeding 70 percent transition efficiency triggered live odds shifts of 15 to 25 percent within four minutes of the first such sequence. Bettors monitoring these patterns often pivot from pre-match accumulators to single in-play wagers on corners or cards that follow from sustained pressure.
League Variations and Pattern Recognition
Patterns differ sharply across competitions because pitch dimensions and tactical setups alter how quickly transitions develop. Bundesliga matches, for instance, produce transition events 18 percent more frequently than La Liga encounters, a disparity reflected in live market volatility tracked by European data providers. Analysts cross-reference these rates with player-specific sprint metrics and pass completion percentages in the final third, allowing adjustments to goal-line or player-prop bets as fatigue sets in during the second half.
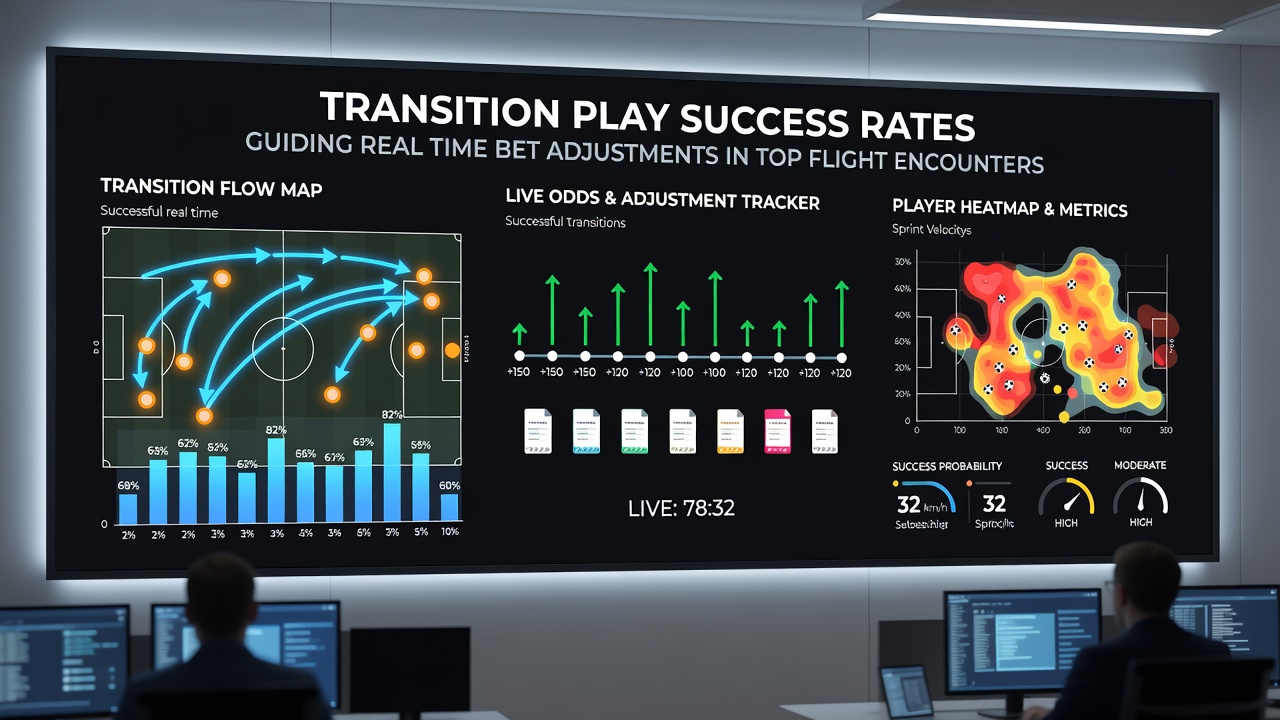
What's interesting here is how managers' substitutions influence those same rates; data compiled across 2026 fixtures shows that introducing wide attackers with high recovery speeds lifts transition success by 12 to 14 points in the final 25 minutes. This shift prompts immediate recalibration of half-time accumulators toward goal or card markets that reward the accelerated tempo.
Integration With Broader In-Play Strategies
Transition data rarely stands alone and instead combines with set-piece conversion rates and pressing intensity to shape more precise live decisions. Reports from the European Club Association highlight that clubs with balanced profiles across these three areas maintain steadier live odds movements, whereas outliers experience sharper swings when transitions suddenly improve. Bettors who layer transition success onto existing models for yellow-card accumulation or corner counts often secure edges that narrow as matches progress into added time.
Examples From Recent Campaigns
Take a June 2026 Champions League qualifier where one side posted a 78 percent transition completion rate in the opening 20 minutes; live markets adjusted goal totals upward by half a goal within moments, and subsequent scoring confirmed the pattern. Similar sequences appeared in domestic league rounds throughout spring 2026, where teams sustaining counter-attack efficiency forced bookmakers to shorten lines on both team totals and individual player shots. These adjustments occur faster in August 2026 fixtures because new tracking systems feed data to operators within 30 seconds of each event.
Technological Tools Supporting Adjustments
Modern platforms deliver transition heat maps and sequence timelines that update continuously, enabling bettors to spot deviations from season averages before lines move. Software linked to official league feeds from various federations provides granular breakdowns that separate successful transitions ending in shots from those that stall in midfield. Such tools have grown more prevalent since regulatory bodies in Australia and Canada began requiring transparent data feeds for licensed operators, a move that indirectly benefits those tracking elite European matches.
Academic work from sports science departments at institutions like the University of Groningen further validates how transition rates correlate with physical output metrics, giving bettors additional context when fatigue alters second-half patterns. These studies emphasize that monitoring acceleration counts alongside possession regain zones yields more reliable signals than isolated statistics alone.
Conclusion
Transition play success rates continue to anchor real-time betting decisions because they capture the moments when matches tilt toward decisive actions. Data across top-flight leagues demonstrates consistent links between elevated efficiency and rapid line movements, while technological integration accelerates those responses. Observers tracking these indicators alongside complementary metrics maintain clearer views of how encounters evolve, particularly as the 2026-27 campaign unfolds with enhanced tracking capabilities.