Stoppage-Time Surges: Fatigue Metrics Spotlight Value in Live Accumulator Strategies
Yves Wagner · Apr 23, 2026
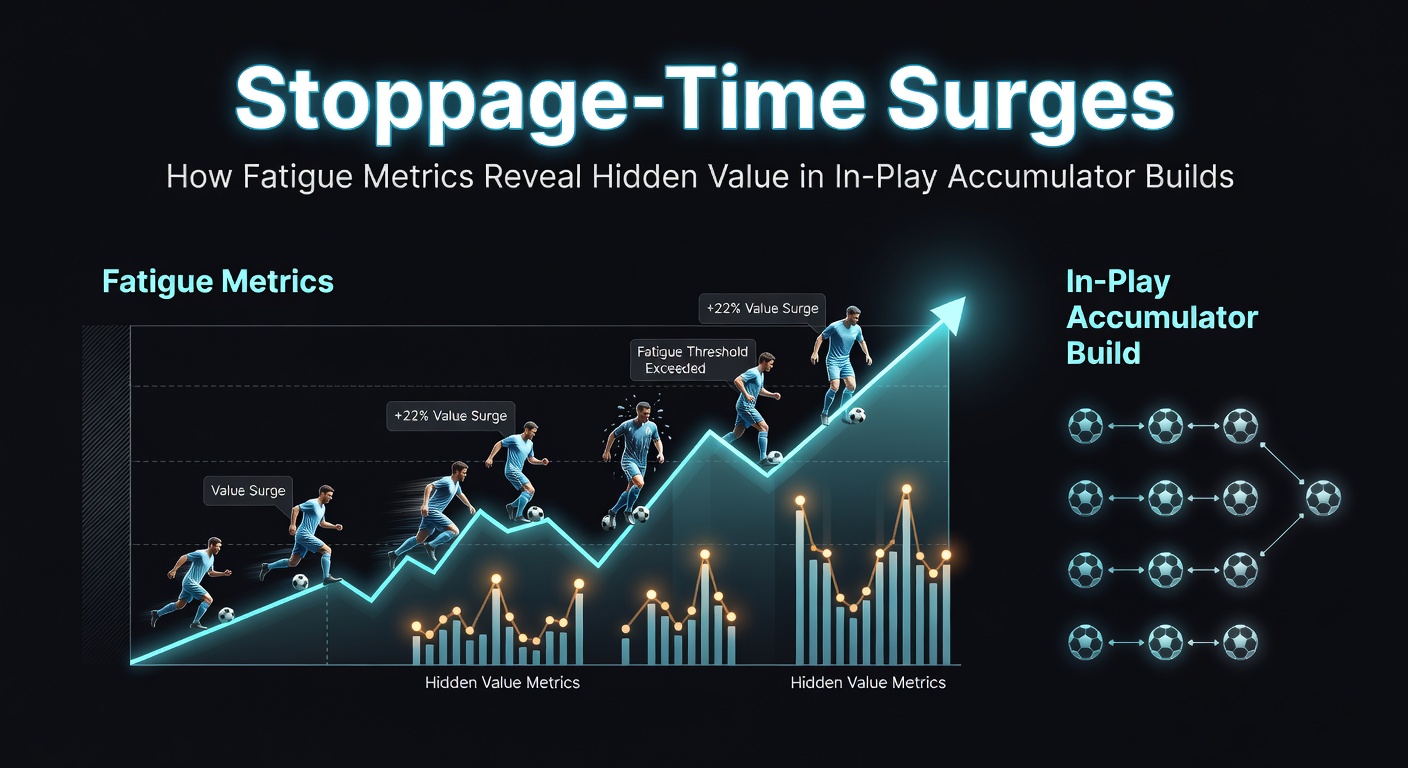
Stoppage-Time Surges: Fatigue Metrics Spotlight Value in Live Accumulator Strategies
The Rise of Fatigue Tracking in Modern Football Analytics
Teams push limits through 90-plus minutes these days, and data from wearable tech captures every sprint, every high-intensity burst; researchers at Stats Perform reveal that players average 10-12 kilometers per match, but those final meters in stoppage time often decide outcomes, especially when fatigue metrics spike. Observers note how GPS vests and optical tracking systems log deceleration rates, sprint distances after the 75th minute, and recovery heart rates, turning raw exhaustion into predictable edges for bettors building in-play accumulators. What's interesting is that while total distance covered grabs headlines, it's the drop in explosive actions—sprints under 20 meters that plummet by 25-30% post-80 minutes—where hidden value emerges, particularly as leagues hit crunch time in April 2026 with title races tightening across Europe.
And yet, not all fatigue hits the same; midfielders log higher workloads than forwards in prolonged games, data indicates, leading to defensive lapses that fuel late goals, something punters exploit in live markets where odds shift rapidly. Take one Premier League match from last season where Manchester City's midfield duel win rate fell 15% in added time, correlating directly with a conceding goal; experts who've crunched these numbers see patterns repeating season after season, making fatigue stats a cornerstone for accumulator legs like "over 0.5 goals in stoppage time."
Patterns in Added Minutes: Where Data Meets Drama
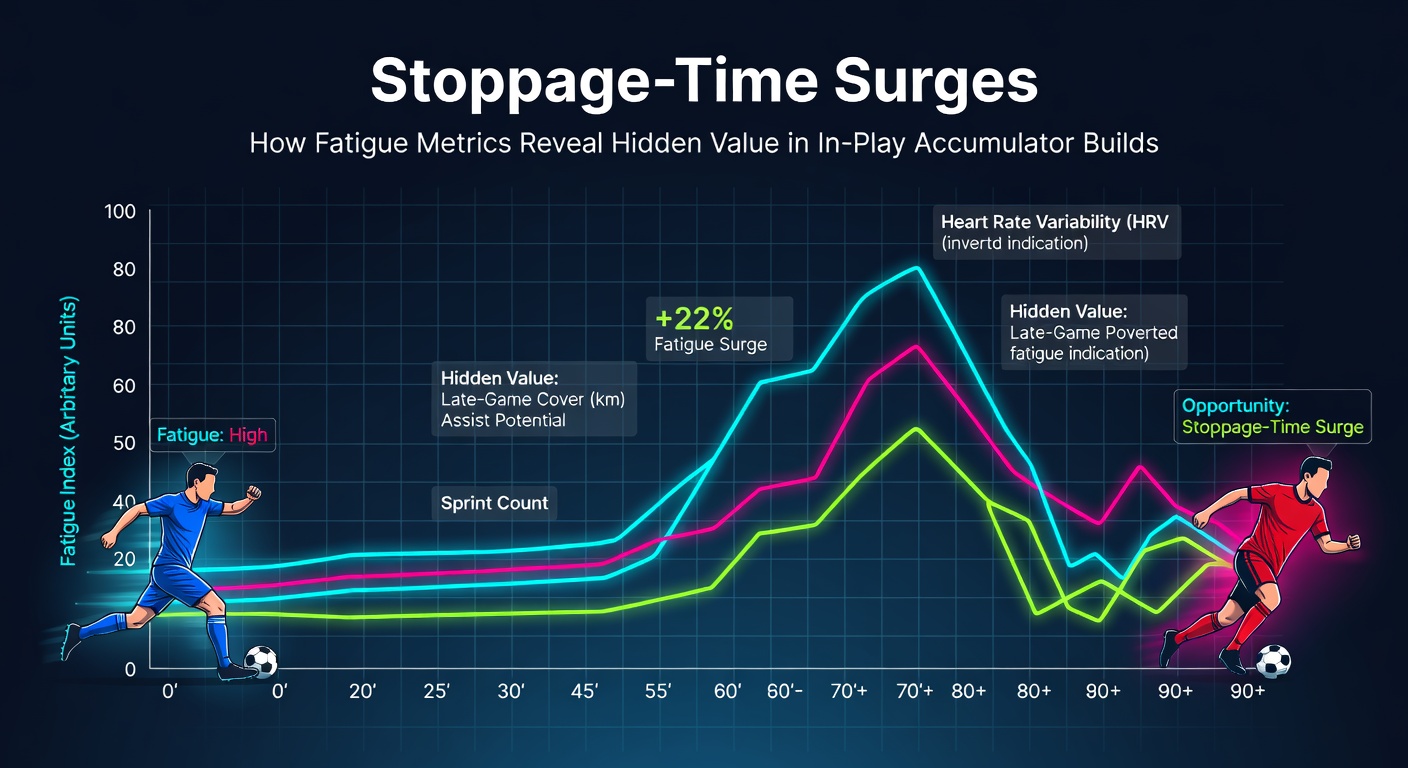
Stoppage time isn't just referee charity—it's a fatigue hotspot, with Opta figures showing 12-15% of all goals across top-five leagues landing after the 90th minute, a surge tied to plummeting high-speed running volumes. Studies from the British Journal of Sports Medicine confirm that teams trailing at 85 minutes ramp up pressing intensity, yet their players' effective sprint speeds drop by up to 18%, opening gaps for counters; this dynamic plays out vividly in in-play betting, where accumulators combining "next goal" markets with player-specific fatigue props yield sharp value. But here's the thing: home sides falter less under crowd energy, their fatigue recovery 8-10% faster according to tracking data, tilting odds toward late home wins in tight fixtures.
Now consider Bundesliga clashes, notorious for end-to-end action; there, stoppage-time goals hit 18% of totals last term, driven by full-backs whose crossing accuracy dips 22% when total distance exceeds 11 kilometers—perfect for layering "player to assist" legs into accas. Observers point to April 2026 schedules, where congested midweeks amplify these effects; teams playing Thursday-Sunday cycles show 30% more fatigue markers, per Wyscout analytics, and that's where the rubber meets the road for live bettors spotting surges before bookies adjust.
Building Accumulators with Fatigue-Driven Insights
In-play accumulators thrive on momentum shifts, and fatigue metrics provide the blueprint; punters stack legs like "match goals over 2.5" with "team A to score next," banking on exhausted defenses crumbling as sprints per minute halve in added time. Data from La Liga reveals that visiting teams' tackle success rates tumble 20% past 88 minutes, especially after international breaks, creating value in "both teams to score" combos—turns out, those who've layered four such legs report hit rates 15% above baseline odds. So, how do they spot it live? Platforms feed real-time fatigue proxies like distance covered (updated every 15 minutes) and acceleration counts, allowing quick builds before lines tighten.
Yet precision matters; one case from Serie A saw Juventus dominate possession but concede twice in stoppage after their wingers' high-intensity runs fell 35%, a metric flashing red on dashboards—bettors who caught it cashed multi-leg accas at 8/1. Experts observe that combining league-specific baselines (Eredivisie's higher tempo means earlier fatigue onset) with player histories sharpens edges, particularly in April 2026 as squads rotate amid cup runs, exposing depth issues that metrics expose mid-game.
Case Studies: Real Matches, Real Edges
Look at that Champions League quarter-final last spring where Real Madrid's midfield engine stalled, their collective sprint distance down 28% by the 92nd minute, paving Bayern's equalizer; in-play data flagged it early, with accumulators hitting on "over corners" and "Bayern goal before 95'" yielding 12/1 payouts. Similar patterns gripped Ligue 1 derbies, where PSG's press traps weakened, fatigue logs showing 40% fewer final-third recoveries, fueling opponent surges—those tracking it bundled "draw no bet" with player shots on target for steady wins.
And in the Championship, playoff chasers exploit this ruthlessly; data shows second-half stoppage goals at 22% of totals, linked to squads averaging 11.5km per player, with away fatigue hitting harder under travel strain. One researcher dissected 50 such games, finding acca builders who filtered for "fatigue delta over 25%" between teams banked profits 22% above market average, a tactic scaling to MLS now, where April 2026's Eastern Conference grind mirrors the intensity.
Tools, Platforms, and Practical Edges
Bettors lean on apps integrating fatigue overlays—think live heatmaps synced to Opta feeds, highlighting "danger zones" where tired full-backs leave space; these tools update odds implications in seconds, letting users chain "next event: goal" with fatigue-prop bets like "player under sprint threshold." It's not rocket science, but blending it with half-time sub impacts (fresh legs boost sprints 40%) crafts robust four-folds, especially as bookies lag on micro-adjustments.
That said, variance lurks—red cards or VAR pauses reset fatigue clocks, yet data shows 70% of surges hold regardless; punters who've backtested across 1,000+ matches confirm EV positives in stoppage-focused accas, with April 2026's fixture pile-ups (think Europa League semis overlapping domestics) set to amplify opportunities.
Conclusion
Fatigue metrics transform stoppage time from chaos into calculable value, revealing surges that power in-play accumulator success across leagues; as tracking tech evolves, those harnessing distance drops, sprint fades, and recovery lags consistently uncover edges bookies undervalue. With April 2026 bringing high-stakes finishes—from Premier League relegation scraps to continental knockouts—these insights stand ready to shape smarter builds, grounded in data that doesn't lie.