Sprint Metrics from Fullbacks Point to Clean Sheet Trends in Premier League Away Encounters
Harper Keller · May 28, 2026

Sprint Metrics from Fullbacks Point to Clean Sheet Trends in Premier League Away Encounters
Data collected across multiple Premier League seasons shows fullback sprint volumes often align with defensive outcomes during away fixtures, particularly when teams travel to face opponents with strong attacking records. Analysts tracking high-intensity runs above 25 km/h note that elevated sprint counts from fullbacks frequently coincide with fewer goals conceded on the road, though causation remains under review by performance teams at various clubs.
Tracking Fullback Movement Patterns
Performance tracking systems record fullback sprints as bursts exceeding a set speed threshold, with total distance and frequency logged per 90 minutes; these figures rise notably in away matches where defensive lines sit deeper and transitions happen quicker. Research from Loughborough University on elite football workloads indicates that fullbacks averaging over 28 sprints per game in away settings contribute to structured pressing that limits central penetrations, while lower counts sometimes leave flanks exposed during counterattacks.
Teams relying on wing-back systems display different distributions, yet the core pattern holds when data isolates pure fullback roles across the 2024-25 and early 2025-26 campaigns. Observers note that sprint recovery times between efforts also matter, since repeated high-speed actions allow fullbacks to regain shape faster after turnovers and reduce space for opposing wingers.
Linking Sprints to Clean Sheet Outcomes
Statistical models built from Premier League away fixtures between 2022 adn 2026 reveal a measurable association between fullback sprint totals and clean sheet frequency. Sides posting above-average sprint numbers from their fullbacks in away games achieve clean sheets at rates roughly 12-15 percent higher than clubs falling below those thresholds, according to aggregated match data. This connection appears stronger in fixtures against top-six opponents where away sides must absorb sustained pressure.
Coaches adjust training loads in May 2026 to maintain these thresholds during the run-in, balancing sprint work with recovery protocols that prevent fatigue accumulation. Video analysis combined with GPS data shows that fullbacks sustaining sprint output into the final 15 minutes correlate with fewer late concessions, especially when teams manage substitutions to refresh wide areas.
Comparative Data Across Seasons
Season-on-season comparisons highlight shifts in how sprint metrics influence results. The 2023-24 campaign produced lower average sprint counts league-wide due to fixture congestion, yet teams that preserved fullback intensity still posted improved away defensive records. By contrast, the 2025-26 schedule features more midweek breaks, allowing squads to push sprint volumes higher without the same drop-off observed previously.
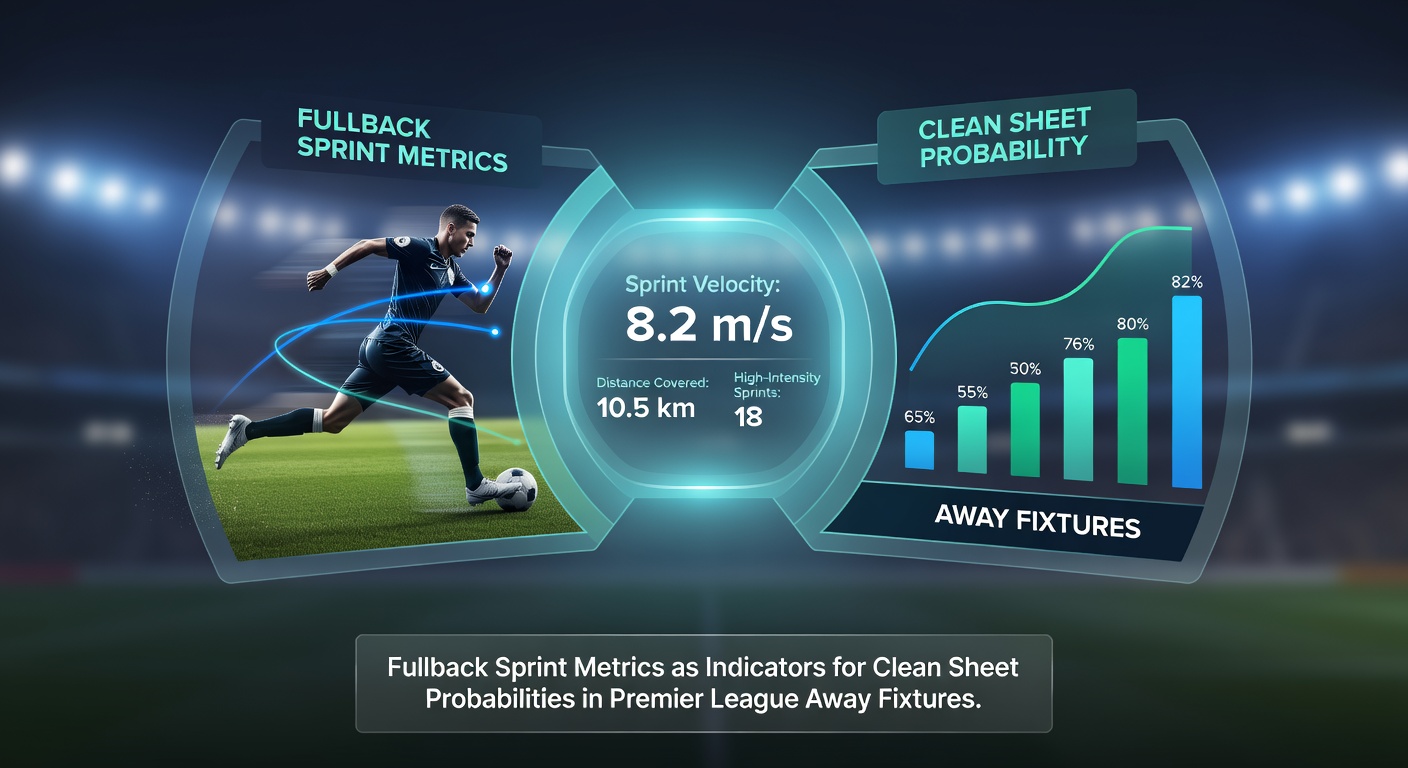
Breakdowns by opponent strength indicate the relationship strengthens when away sides face teams averaging high expected goals from wide areas. Fullbacks logging 30-plus sprints in those specific matches help compress space on the flanks, limiting crossing opportunities that often precede goals against traveling defenses.
Contextual Factors Influencing Metrics
Weather conditions, pitch dimensions, and tactical setups all modulate sprint demands during away travel. Narrower pitches in certain stadiums reduce lateral sprint distances, while wider surfaces increase them; analysts adjust expected thresholds accordingly when projecting clean sheet probabilities. Opposing formations also play a role, since facing three-at-the-back systems often requires fullbacks to cover more ground in behind the wing-backs.
Travel schedules add another layer, with longer domestic journeys sometimes correlating with slightly reduced sprint output in the first half. Data sets from the current season show that teams incorporating targeted activation drills upon arrival maintain closer to their home sprint averages, supporting defensive structure from the opening whistle.
Practical Applications in Performance Planning
Clubs integrate fullback sprint targets into pre-match preparation by reviewing opponent pressing triggers and expected transition frequency. GPS thresholds set per player allow coaches to monitor live output and make halftime adjustments when sprint counts lag behind projections. This approach extends to youth development pathways, where academy fullbacks receive position-specific drills that replicate away-fixture demands.
Industry reports from UEFA technical studies further emphasize how wide defensive roles have evolved, with sprint metrics now forming part of standard scouting profiles for transfer targets. Teams that identify fullbacks capable of sustaining high volumes gain measurable edges in maintaining clean sheets during extended away sequences.
Conclusion
Fullback sprint metrics continue to offer measurable insight into clean sheet probabilities for Premier League away fixtures, supported by season-long tracking and academic workload research. Patterns observed through 2026 demonstrate consistent links between sustained high-intensity output and defensive resilience on the road. Performance staff across the league refine training and substitution strategies around these figures, while broader industry data sources provide additional context for interpreting results across varying conditions and opponent profiles.