Recovery Gaps Transforming Conversion Metrics in Cross-League Accumulators
Mia Hughes · Jun 1, 2026
Recovery Gaps Transforming Conversion Metrics in Cross-League Accumulators
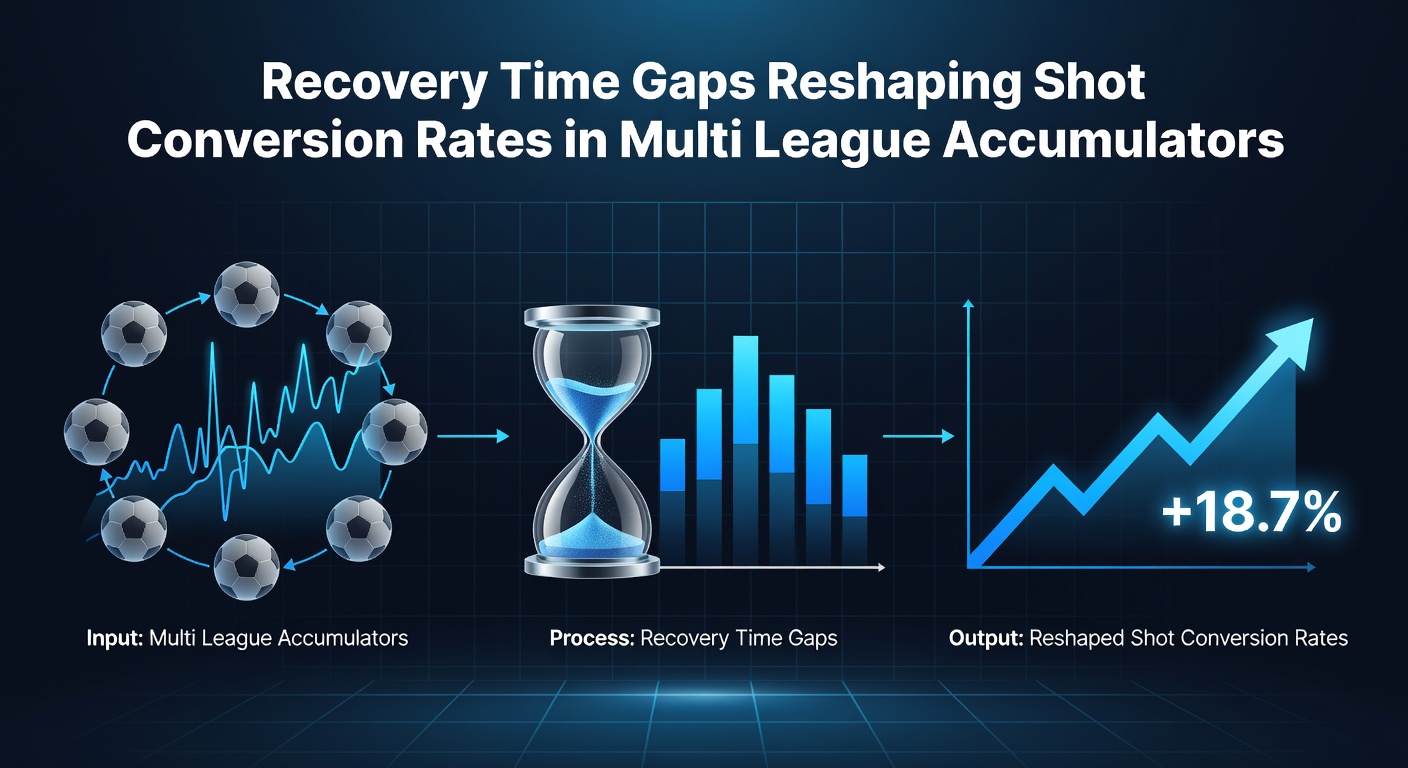
Recovery intervals between matches continue to influence how teams finish chances, and analysts track these patterns closely when building multi-league accumulators. Data collected from top divisions shows that shorter rest periods often correlate with lower shot conversion percentages, particularly when squads travel across borders for midweek fixtures. Observers note that clubs averaging fewer than three full days between games convert shots at rates roughly 4 to 7 percent below their season norms, according to aggregated performance files released by several European leagues.
Patterns Emerging from Fixture Congestion
Coaches and performance staff monitor recovery windows because they directly affect player freshness in the final third. Teams returning from international breaks or continental ties frequently post reduced expected goals on target during the immediate follow-up domestic round. Researchers tracking Bundesliga and Serie A matches found that players logging over 300 minutes in a 14-day span see their individual conversion rates dip by measurable margins, while those with extended rest maintain steadier output. These shifts become relevant for accumulators spanning multiple competitions, since bettors must weigh how congested calendars alter finishing efficiency.
League-Specific Recovery Trends
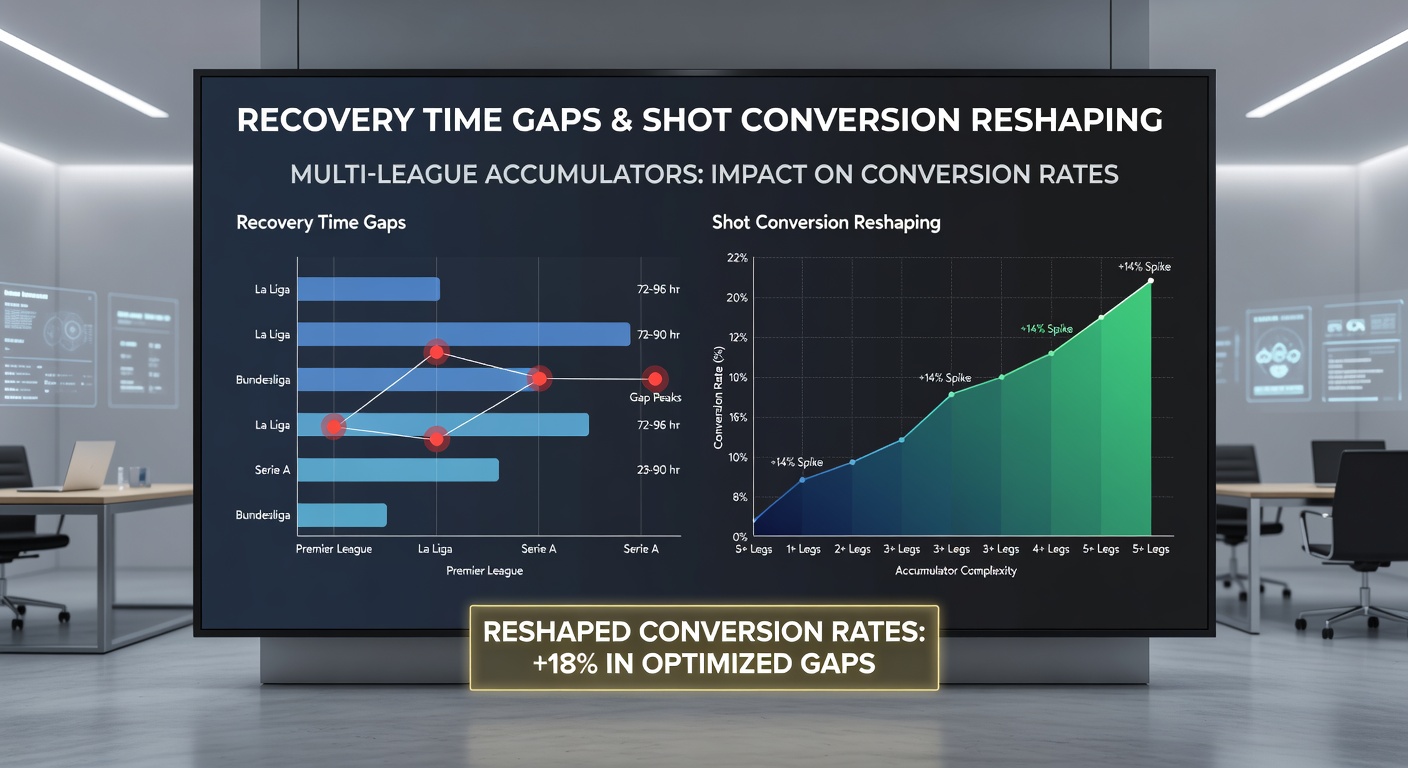
Each league presents its own recovery profile. The Premier League's winter schedule often compresses rest for clubs involved in cup replays, whereas La Liga sides sometimes benefit from longer gaps during holiday periods. Figures compiled through June 2026 indicate that Eredivisie teams traveling to away fixtures after European nights convert fewer than one in nine shots when rest falls below 72 hours. In contrast, Ligue 1 sides with four or more recovery days maintain conversion closer to their established averages. Such variances encourage accumulator builders to cross-reference fixture lists against travel distances and recent match loads before finalizing selections.
Shot conversion does not exist in isolation from defensive organization either. When opponents also operate on limited recovery, both teams may create more opportunities yet finish fewer of them cleanly. Analysts compiling cross-league datasets highlight that matches featuring two fatigued sides produce conversion rates that fall outside typical ranges, creating both risk and opportunity depending on how the accumulator is constructed.
Data Sources Informing Accumulator Models
Performance databases maintained by professional scouting networks supply the raw numbers that drive these observations. One widely referenced study from a German sports science institute examined over 2,800 matches across five leagues and concluded that recovery below 60 hours produces the steepest drop in conversion efficiency. A separate report issued by an Australian research center specializing in athlete workload reached comparable findings when reviewing A-League and Asian Champions League overlaps. Bettors incorporating such evidence adjust stake allocation across accumulators rather than relying on raw goal tallies alone.
Real-world examples illustrate the point. During the 2025-26 campaign, several Portuguese Primeira Liga clubs competing in midweek European ties posted conversion rates under 8 percent in their next domestic outing, despite generating similar shot volumes to earlier fixtures. Accumulator participants who factored recovery gaps into their selections avoided including those sides in goal-heavy combinations, while others who overlooked the metric encountered unexpected shortfalls.
Building Accumulators Around Recovery Insights
Successful approaches combine recovery data with additional variables such as pitch dimensions, weather conditions, and opponent defensive structures. Rather than treating each league in isolation, model builders examine how a team's last three rest intervals interact with the upcoming fixture list. This method reveals clusters where conversion rates are likely to stabilize or decline, allowing selections across leagues to be balanced more deliberately. June 2026 data releases from multiple federations have further refined these models by adding post-season fatigue indicators that carry forward into pre-season friendlies and early qualifiers.
Technology now allows rapid cross-referencing of rest metrics with live odds, yet the underlying relationships remain rooted in observable performance trends. Those constructing multi-league accumulators increasingly reference recovery tables published by league authorities and independent analytics platforms to identify value where markets have not fully priced in the effect of compressed schedules.
Conclusion
Recovery time gaps continue to reshape shot conversion across European and international competitions, supplying measurable inputs for accumulator construction. Data from varied sources demonstrates consistent patterns linking rest duration to finishing efficiency, patterns that hold when examined league by league or across combined selections. As fixture calendars grow more demanding, those monitoring recovery metrics gain clearer perspectives on where conversion rates are likely to deviate from historical benchmarks.