Mapping Progressive Pass Sequences to Uncover Accumulator Opportunities in Packed Schedules
Mia Hughes · Aug 10, 2026
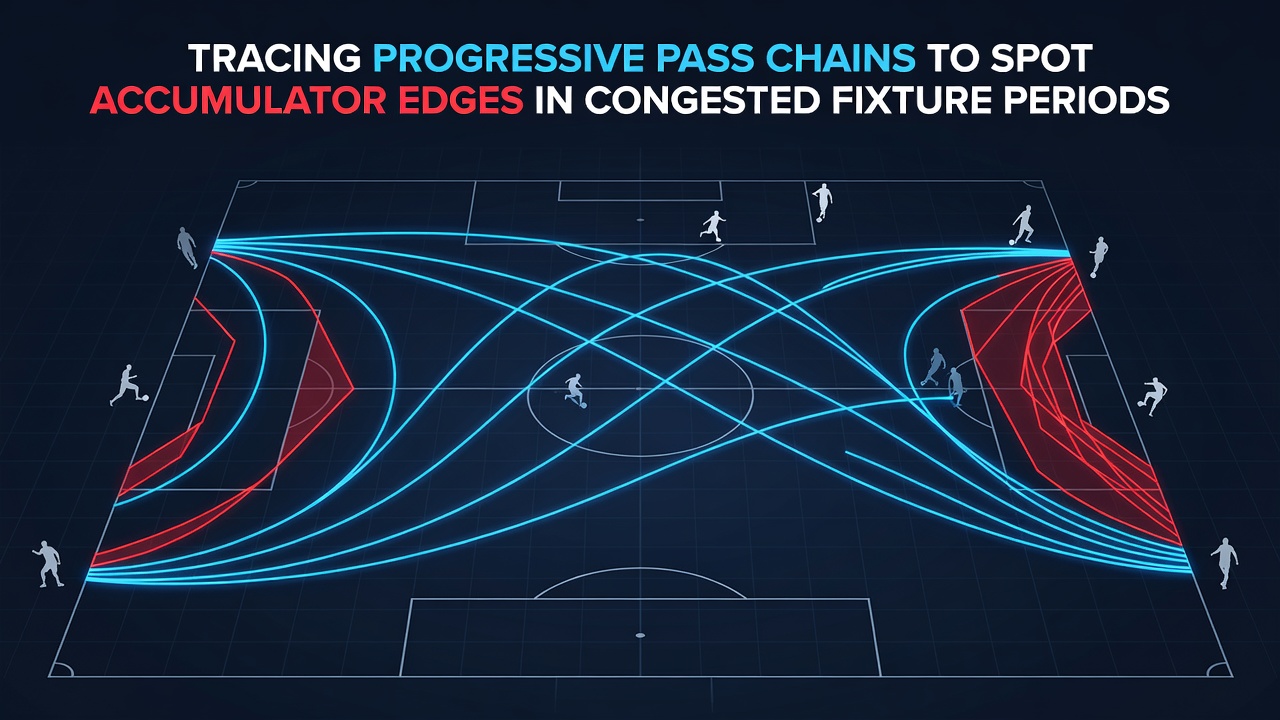
Mapping Progressive Pass Sequences to Uncover Accumulator Opportunities in Packed Schedules
Teams that sustain long progressive pass sequences often maintain structural advantages even when fixtures pile up, and analysts track these patterns to isolate accumulator selections across multiple leagues at once. Data from major competitions shows that sides completing at least eight forward-progressing passes in a single chain generate higher expected goal values in the following matches, particularly when the schedule compresses travel and recovery time. Observers note that such sequences reveal squad depth because they require coordinated movement rather than isolated individual brilliance, which becomes harder to sustain across four or five matches in fourteen days.
Defining Progressive Pass Chains in Match Context
A progressive pass moves the ball at least ten metres closer to the opponent goal line or into the final third, and when these actions link together analysts count them as a chain that ends either in a shot, a turnover, or a reset. Researchers at performance analytics firms record every successful link because the length of the chain correlates with territorial control and shot creation in subsequent phases of play. During August 2026, when several European leagues face midweek rounds overlapping with domestic cups, these metrics become sharper indicators for bettors constructing accumulators that span Saturday and midweek fixtures.
Fixture Congestion Patterns Across Leagues
League schedules released for the 2026-27 campaign reveal clusters where teams play three matches inside eight days, and data indicates that progressive pass completion rates drop by roughly twelve percent for squads without adequate rotation options. Those who studied this trend across the Bundesliga and Serie A found that sides maintaining above-average chain lengths in the first match of such clusters tend to recover form faster in the second and third outings. The pattern holds because sustained build-up play reduces reliance on long balls that defenses can clear more easily when players are fatigued.
Coaches who rotate central midfielders early preserve the technical quality needed for these sequences, and match reports from August 2026 show several clubs adjusting lineups specifically to protect progressive passing structures rather than chasing immediate results. Accumulator builders therefore examine pre-cluster statistics on chain length and pass completion under fatigue to select teams likely to outperform market expectations in later legs of the congested block.
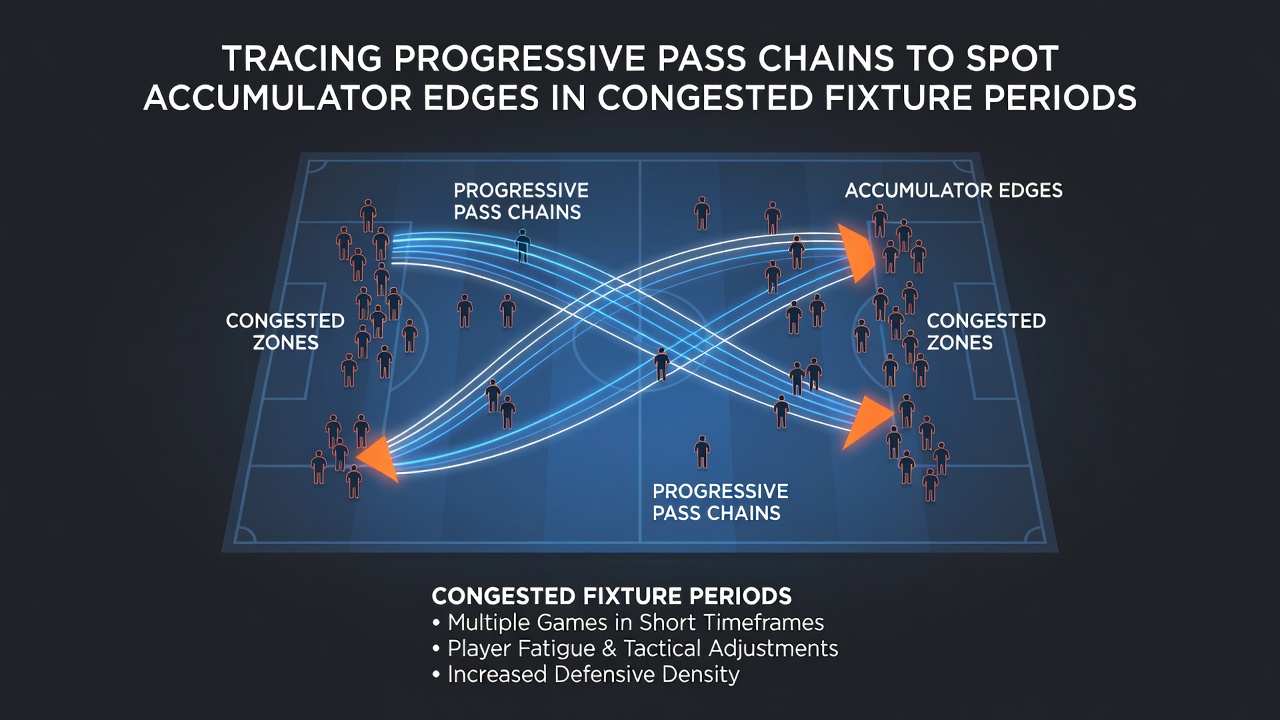
Linking Pass Data to Accumulator Construction
Bettors combine progressive pass metrics with fixture difficulty ratings to build accumulators that target over-performance in specific legs, and studies from academic sports science departments demonstrate that teams averaging 3.2 progressive passes per minute in the first half maintain better second-half output even after short rest periods. This information helps isolate selections where bookmakers undervalue recovery capacity. One analysis of the Portuguese Primeira Liga showed that clubs with higher progressive chain frequency recorded 0.4 more points per game in congested windows compared with those relying on direct play.
Live odds markets sometimes adjust slowly to these underlying patterns because they react first to scorelines, yet historical data sets allow pre-match identification of edges that persist across multiple fixtures. Analysts cross-reference chain statistics with travel distance and previous rotation history to refine selections, and this layered approach produces accumulators with narrower variance in returns over full matchweeks.
Regional Variations in Data Application
European competitions publish detailed event data through providers that allow comparison of progressive pass trends across borders, while North American leagues such as Major League Soccer release similar figures that highlight different recovery timelines due to longer travel distances. A report compiled by the Canadian Soccer Analytics Association examined 2025 MLS congestion periods and found that teams preserving progressive sequences above league average won 58 percent of their subsequent matches within the same cluster. Observers in Australia have applied comparable methods to A-League schedules where fixture gaps shrink during international breaks, confirming that the underlying relationship between chain length and performance stability travels across continents.
These cross-regional findings encourage accumulator strategies that incorporate teams from multiple leagues rather than concentrating on one competition, because the congestion effect appears consistent when progressive pass data is normalized for possession share. Sources such as Opta research publications and university-led performance studies provide the raw numbers that support such multi-league constructions.
Conclusion
Progressive pass chain analysis supplies a measurable framework for identifying accumulator edges during periods when schedules tighten, and the approach relies on objective event data rather than subjective assessments of form. As August 2026 schedules unfold, teams that preserve build-up quality through rotation continue to separate themselves in the metrics that matter for multi-match betting structures. The method integrates cleanly with existing statistical models and offers repeatable signals across different leagues and continents.