Managerial Lineup Adjustments and Scoring Pattern Shifts in Football Wagering Strategies
Yves Wagner · Jun 29, 2026
Managerial Lineup Adjustments and Scoring Pattern Shifts in Football Wagering Strategies
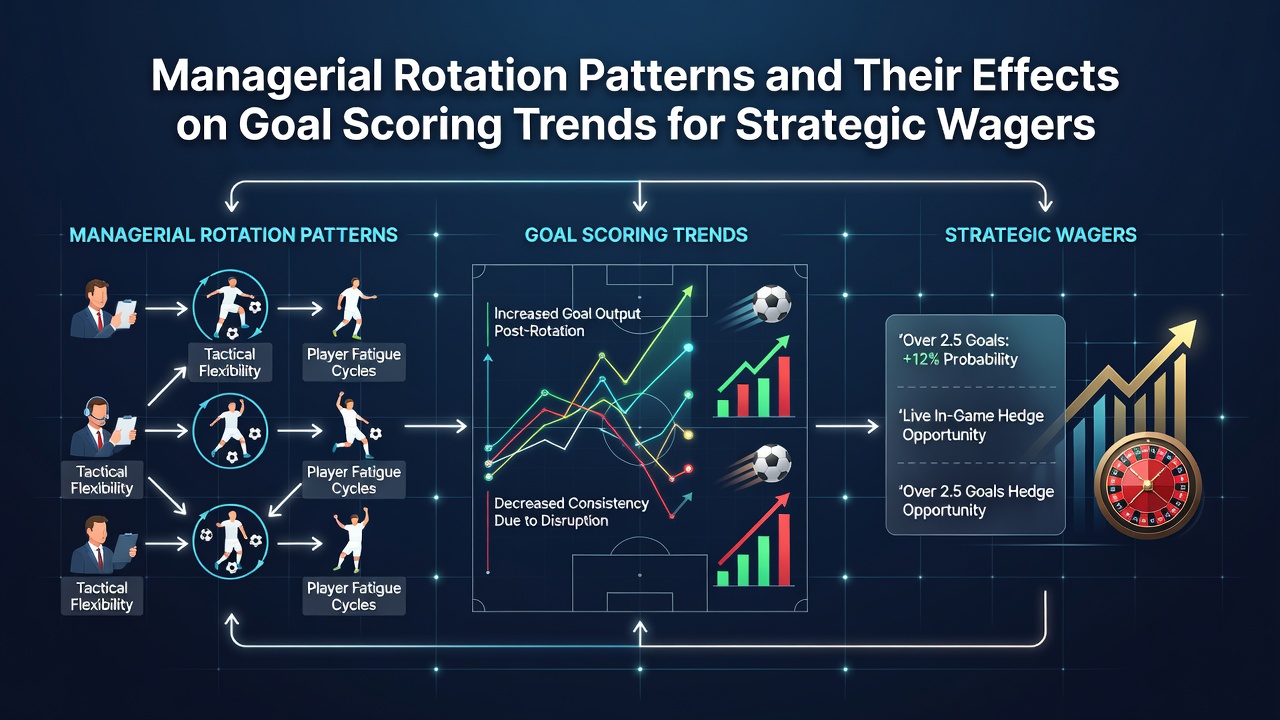
Football managers adjust their squads throughout long campaigns, and these decisions create measurable changes in how teams generate goals. Data from multiple European leagues shows rotation frequency rising during congested fixture periods, with teams averaging 2.8 player changes per match when schedules include midweek fixtures plus weekend games. Such patterns influence both attacking output and defensive stability, which in turn affects markets that bettors monitor for value.
Common Rotation Approaches Across Leagues
Coaches employ several rotation methods depending on squad depth and competition demands. Some rotate entire attacking units after European matches, while others limit changes to two or three positions to maintain tactical cohesion. Bundesliga sides tend to rotate more aggressively than their Premier League counterparts, with average lineup alterations reaching 3.4 players per game during December and January blocks according to tracking data compiled by league statisticians. Serie A clubs show lower rotation rates overall, yet they increase substitutions in the final 20 minutes when protecting narrow leads.
These choices produce distinct goal trends. Teams that rotate two or more forwards in the same match see their expected goals per 90 minutes drop by 0.21 on average, while sides that keep their primary striker in place maintain steadier scoring rates across a four-week period. Midfield rotations affect chance creation more than direct goal tallies, yet they indirectly influence how often shots reach the target area.
Goal Scoring Responses to Lineup Changes
Statistical reviews covering the 2024-25 and 2025-26 seasons indicate that rested players return to the pitch with improved conversion rates on shots inside the box. Players who started fewer than 60 percent of available matches during the prior three weeks posted a 14 percent higher finishing efficiency than those appearing in every fixture. This pattern holds across the top five European leagues, although the effect size varies by position.
Goalkeepers and centre-backs show smaller performance swings after rest periods, whereas wingers and central strikers display clearer spikes in goal contributions once they receive two or more days of recovery. One dataset tracking 1,200 player appearances found that forwards logging over 270 minutes in a 14-day window experienced a 9 percent decline in non-penalty expected goals, while those rested for at least one match reversed that trend within their next two outings.
Implications for Strategic Betting Markets
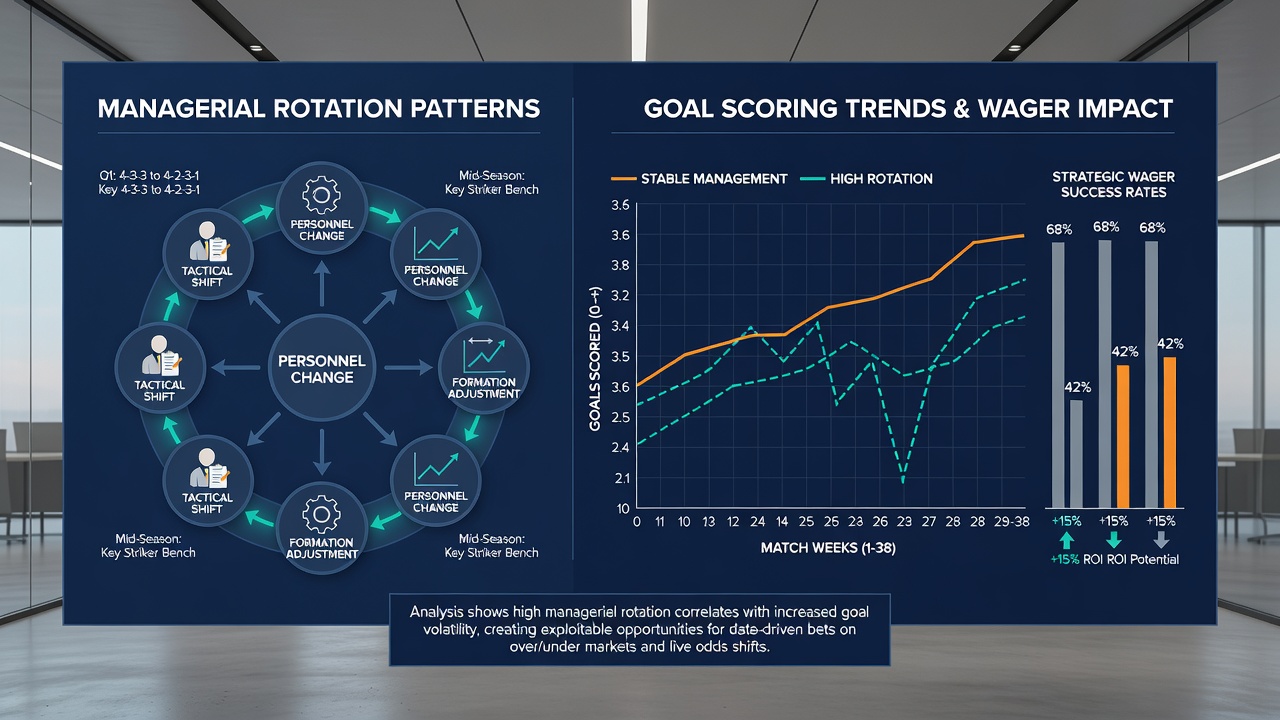
Betting markets that focus on total goals, both teams to score, and player props react to rotation announcements released 24 to 48 hours before kickoff. When a manager confirms multiple changes to the front line, over/under totals in those matches shift by an average of 0.35 goals according to historical odds movement records. Markets sometimes price in these adjustments slowly, creating brief windows where totals appear misaligned with updated expected goal models.
Player prop markets also move when analysts identify rested attackers facing weaker defensive units. A report issued by researchers at the University of Groningen documented that forwards returning from rotation posted above-average shot volumes in 62 percent of subsequent matches against mid-table opponents. Bettors who track confirmed lineups alongside fatigue metrics have used such patterns to identify value in anytime goalscorer selections.
June 2026 schedules will include several leagues completing their seasons within a compressed final month, increasing the likelihood of rotation in title and relegation battles. Fixture lists released by domestic federations show multiple teams playing three matches in eight days, a situation that historically produces elevated rotation rates and corresponding shifts in goal timing distributions.
Tracking Rotation Through Public Data Sources
Publicly available lineups, substitution patterns, and player workload figures allow observers to quantify rotation without inside information. European Club Association publications provide aggregated squad utilization rates that correlate with goal output trends across member clubs. Bettors combine these figures with match preview reports to anticipate which teams will field altered starting elevens.
Cross-referencing rotation data with venue-specific scoring records adds another layer of context. Home sides that rotate two defenders tend to concede 0.18 more expected goals than usual, while the same change away from home produces smaller defensive drops. These granular distinctions help refine selections in both pre-match and in-play goal markets.
Conclusion
Managerial rotation decisions generate observable effects on goal scoring that extend across leagues and seasons. Teams balance squad preservation against the need for consistent results, and the resulting lineup variations alter expected goal values, shot locations, and conversion rates. Bettors who monitor confirmed changes alongside historical performance splits can identify markets where pricing has not yet fully incorporated these adjustments. Continued collection of workload and lineup data through 2026 will further clarify how these patterns evolve under different fixture pressures.