Fatigue Tracking Tools Redefine How Performance Data Gets Interpreted for European Midweek Fixtures
Yves Wagner · Jul 30, 2026
Fatigue Tracking Tools Redefine How Performance Data Gets Interpreted for European Midweek Fixtures
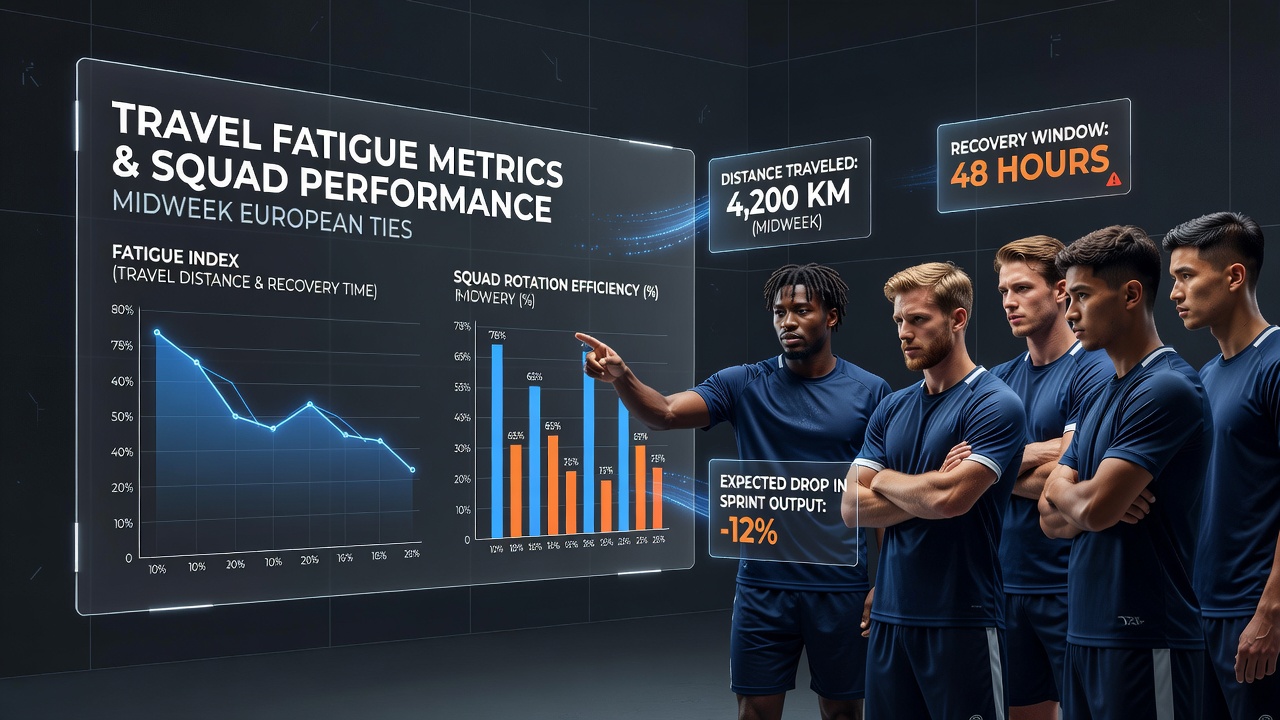
European football schedules pack midweek ties into calendars already crowded with domestic league commitments, and analysts now track travel fatigue through specific metrics that adjust raw performance numbers. Clubs competing in the UEFA Champions League or Europa League often cover hundreds of kilometers between matches, while time zone shifts compound recovery demands for squads crossing multiple borders in a single week. Data platforms collect flight durations, sleep disruption logs, and training load adjustments to recalibrate expected outputs such as total distance covered, high-intensity sprints, and pass completion rates.
Core Metrics Driving the Shift
Performance databases incorporate variables like cumulative travel distance since the previous match, circadian rhythm offsets, and hotel check-in times to create adjusted benchmarks. A midfielder who logs 650 kilometers after a Sunday fixture may show a 12 percent drop in sprint volume during the Wednesday return leg, yet unadjusted models previously attributed that decline solely to tactical changes. Researchers at the German Sport University Cologne have published algorithms that factor these elements into squad reports, allowing scouts and analysts to separate genuine fitness trends from schedule-induced variance.
Coaches receive updated heatmaps that overlay fatigue scores onto player positions, revealing clusters where recovery shortfalls most affect pressing triggers or set-piece delivery. One study tracking 180 Champions League group-stage matches from the 2024-25 campaign found that teams traveling over 800 kilometers midweek recorded 8.4 percent fewer successful tackles in the opening 30 minutes compared with home fixtures on similar rest cycles.
Case Examples Across Leagues
Consider a Serie A side flying from Milan to Lisbon for a Europa League group game. GPS data logged an average sleep reduction of 92 minutes per player on the outbound leg, correlating with a measurable increase in error rates during build-up play. Analysts adjusted the squad's expected pass accuracy downward by 4.7 percentage points before kickoff, aligning closer to observed figures once the match concluded. Similar recalibrations appear in Bundesliga and La Liga datasets when teams face consecutive long-haul trips.
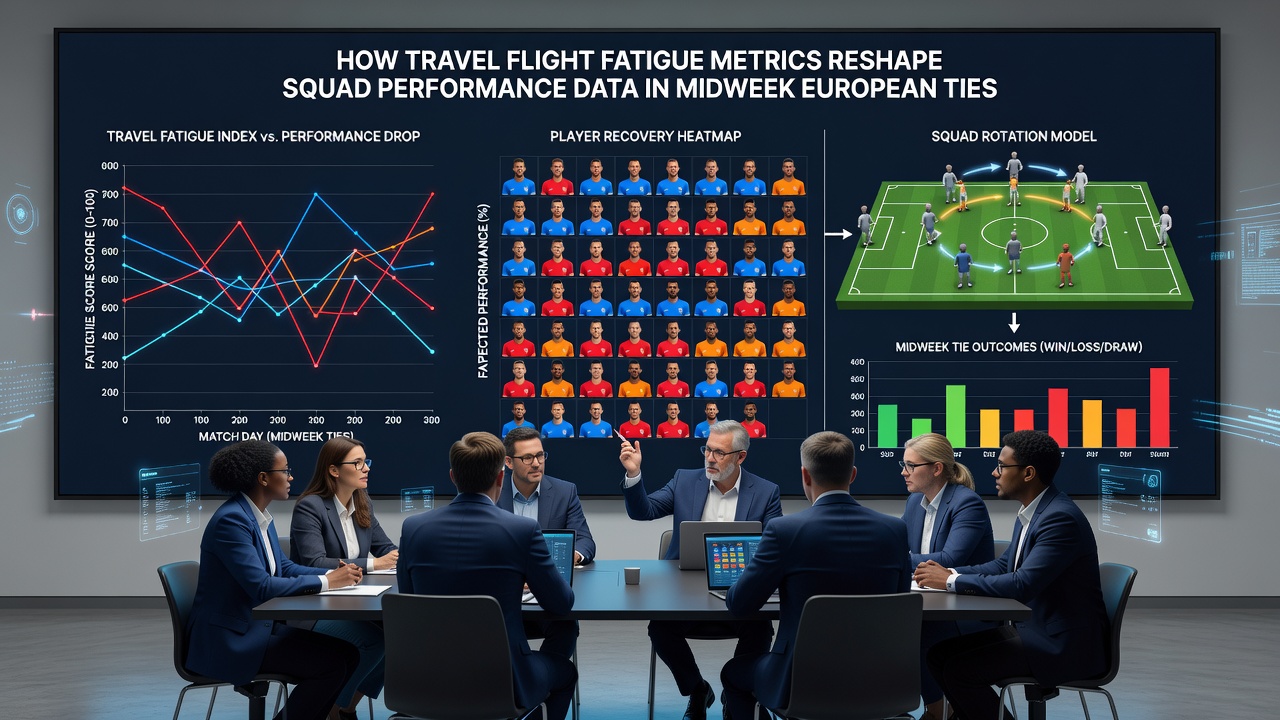
Premier League clubs have adopted parallel systems after the 2025 introduction of enhanced fixture calendars. Liverpool's data team, for instance, began publishing internal fatigue indices that flag when accumulated air miles exceed seasonal thresholds. These indices now feed into public performance summaries shared with broadcast partners, changing how commentators frame second-half substitutions.
Impact on July 2026 Preparations
As clubs plan for the 2026-27 campaign, July pre-season tours already incorporate fatigue modeling software that simulates midweek European travel scenarios. UEFA's updated club licensing requirements, effective from summer 2026, mandate that academies demonstrate access to travel-adjusted analytics before receiving participation clearance for continental youth competitions. National associations in Spain and France have rolled out pilot programs where academy matches include standardized fatigue scoring sheets alongside traditional match reports.
Academic partners at the University of Queensland contribute longitudinal datasets comparing southern hemisphere travel patterns with European ones, highlighting how humidity combined with flight time alters muscle recovery timelines. These cross-regional findings help European clubs refine hydration and nutrition protocols ahead of July training camps that double as fatigue baseline collection periods.
Adjustments in Data Presentation
Statistical providers now split performance tables into raw and fatigue-adjusted columns, allowing users to toggle between views. A winger who records 3.2 kilometers of high-speed running may see that figure marked as above average once travel load receives its weighting. This dual presentation reduces misinterpretation when comparing home and away performances across congested periods.
Media outlets have begun citing these adjusted numbers in post-match breakdowns, while betting data aggregators integrate the metrics to refine expected goal models for Thursday night fixtures. The shift creates consistency between video analysis and numerical summaries that previously diverged during heavy travel weeks.
Conclusion
Travel fatigue metrics now sit alongside traditional indicators such as possession and shots on target when evaluators assess squad output in midweek European ties. By embedding flight logs, sleep data, and recovery timelines into performance platforms, analysts produce clearer pictures of true player capacity rather than schedule artifacts. As July 2026 approaches, clubs and governing bodies continue expanding these tools, ensuring that future datasets reflect both athletic output and the logistical realities of continental competition.