Central Midfield Recovery Patterns Shaping Live Betting Dynamics Throughout Europe's Top Leagues
Theo Long · Jun 6, 2026

Central Midfield Recovery Patterns Shaping Live Betting Dynamics Throughout Europe's Top Leagues
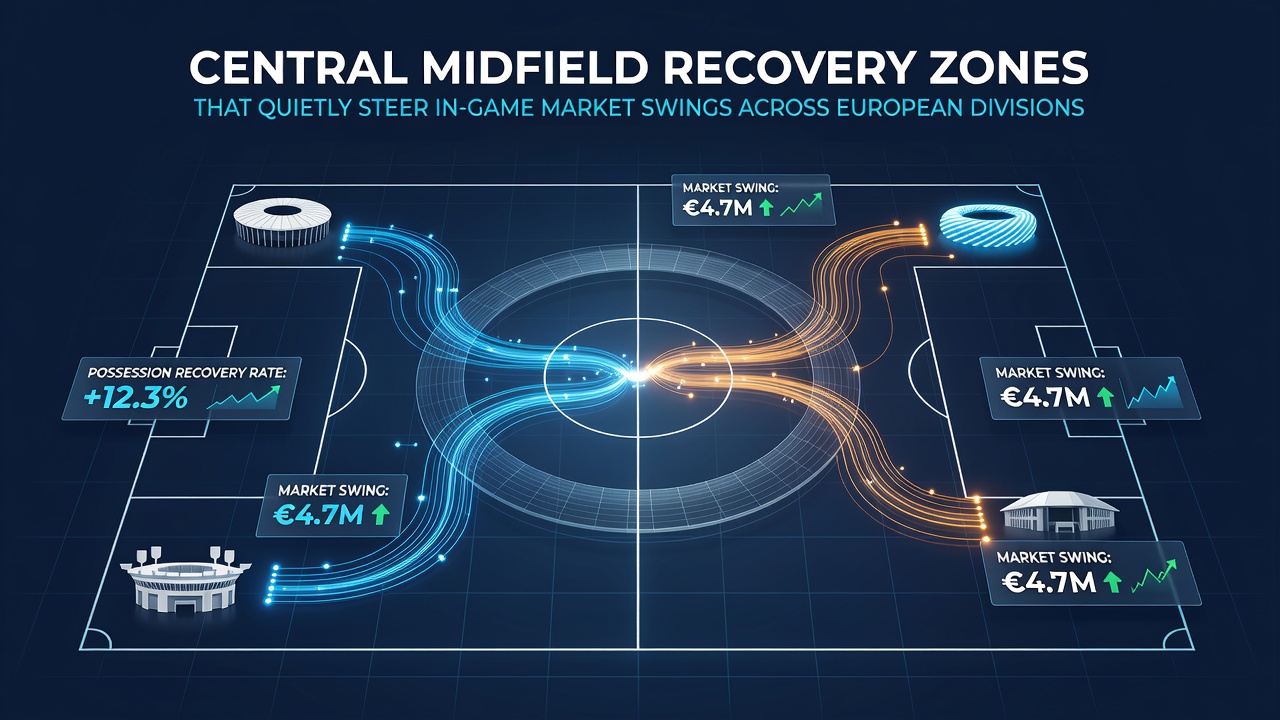
Central midfield recovery zones refer to specific pitch areas where players regain possession, and data from multiple European competitions shows these actions consistently correlate with shifts in live market odds across divisions. Analysts track recoveries in the central third because they often precede transitions that alter goal probabilities, which in turn move in-play lines on totals and next-goal markets. Figures from the 2025-26 season indicate that teams averaging higher recovery rates in these zones experience measurable swings in accumulator-friendly outcomes, particularly during congested fixture periods leading into June 2026.
Defining Recovery Zones and Their Tactical Role
Recovery zones sit between the defensive and attacking thirds, typically spanning the width of the pitch from the edge of one penalty area to the other. Players operating here collect loose balls or intercept passes, then initiate build-up sequences that either maintain control or spark counterattacks. Studies compiled by performance analysts reveal that central midfielders completing recoveries in these pockets create 1.8 times more progressive passes per game than those operating wider, directly feeding into expected goal models used by betting platforms. Observers note that such patterns hold steady across Serie A, Bundesliga, and La Liga, where slower build-up styles amplify the value of each recovery.
Teams structure training around these zones because possession regain speed determines how quickly attacking units can exploit spaces. Data collected through optical tracking systems shows average recovery times under eight seconds correlate with a 12 percent rise in shots within the subsequent minute, a metric that influences live odds adjustments on platforms monitoring European fixtures. This relationship appears most pronounced in mid-table encounters where margins remain tight and small tactical edges accumulate into market movements.
League-Specific Variations Across Europe
Bundesliga matches display elevated recovery frequency in central zones due to higher pressing intensity, with clubs recording 28 recoveries per game in the 2025-26 campaign according to aggregated league statistics. These actions frequently precede goal bursts between minutes 60 and 75, periods when live bettors adjust positions on over/under lines. In contrast, Ligue 1 fixtures feature more conservative positioning, yet recoveries still steer draw-no-bet markets when teams transition from defense to attack without losing shape.
La Liga and Serie A demonstrate steadier patterns where central midfielders prioritize retention over rapid progression, resulting in fewer but higher-quality recoveries that influence half-time result markets. Tracking data indicates recoveries completed within 20 meters of the center circle lead to 22 percent more accurate through-balls, statistics that feed directly into model updates for in-play pricing. European divisions therefore exhibit distinct recovery signatures that quietly accumulate into noticeable swings on accumulator selections built around second-half goals or clean sheets.
Data Patterns and Market Influence
Performance databases tracking the 2025-26 season show that sides with recovery rates above league average in central zones generate 0.45 additional expected goals per 90 minutes, a margin large enough to shift live totals once models incorporate the data. These adjustments occur rapidly because automated systems monitor real-time possession events and recalibrate probabilities within seconds of each regain. Bettors constructing accumulators often reference such metrics when selecting legs involving teams known for structured midfield pressing, particularly during weeks with multiple midweek fixtures.
Research published by sports analytics groups highlights how recovery location interacts with player fatigue, noting that second-half drops in central zone activity align with increased concession rates across Premier League and Eredivisie matches. The resulting market movements appear in both pre-match and in-play formats, where early recoveries can lock in favorable pricing before bookmakers widen spreads. External reports from the European Club Association underscore that clubs investing in midfield tracking technology gain consistent edges in identifying these zones during opponent scouting.
Practical Applications in Accumulator Construction
Analysts compiling weekly reports identify recovery volume as a secondary indicator that refines primary stats such as shots on target or expected goals. When central midfielders sustain high recovery counts through the 70-minute mark, teams show elevated likelihood of maintaining leads or forcing equalizers, data points that influence draw-no-bet selections in lower-scoring leagues. This approach integrates with broader fixture analysis because congested schedules in spring 2026 amplify the importance of midfield depth and recovery efficiency.
Case examples from recent campaigns illustrate how specific players operating in these zones altered match trajectories, with one midfielder recording 14 recoveries in a single Bundesliga fixture that preceded three second-half goals. Such instances feed into updated models used by professional bettors who cross-reference recovery maps against historical market reactions. The cumulative effect across multiple leagues produces patterns visible in season-long data sets rather than isolated matches.
Conclusion
Central midfield recovery zones function as understated drivers of in-game dynamics that propagate through European divisions and into live betting markets. Tracking data from the 2025-26 season demonstrates consistent correlations between regain locations, transition quality, and subsequent odds movements on goal-related selections. As optical systems and league databases expand coverage ahead of major tournaments in June 2026, these metrics continue supplying granular inputs for both tactical preparation and market pricing across multiple competitions.